New Feature Spotlight: Indicator Profiling helps you find alpha generating Indicators
Ever wonder if your favorite technical indicator is actually giving you the edge you think it is? Today, we’re excited to release Indicator Profiling - a powerful new feature that lets you dissect any indicator’s predictive capabilities with just a few clicks.
What Is Indicator Profiling?
Think of it as your indicator’s statistical health check. Our new tool creates a comprehensive analysis suite that helps you understand:
- How your indicator relates to future price movements
- Where the “sweet spots” are in your indicator’s range
- How the indicator behaves over time
- What patterns emerge in its distribution
Four Views, Countless Insights
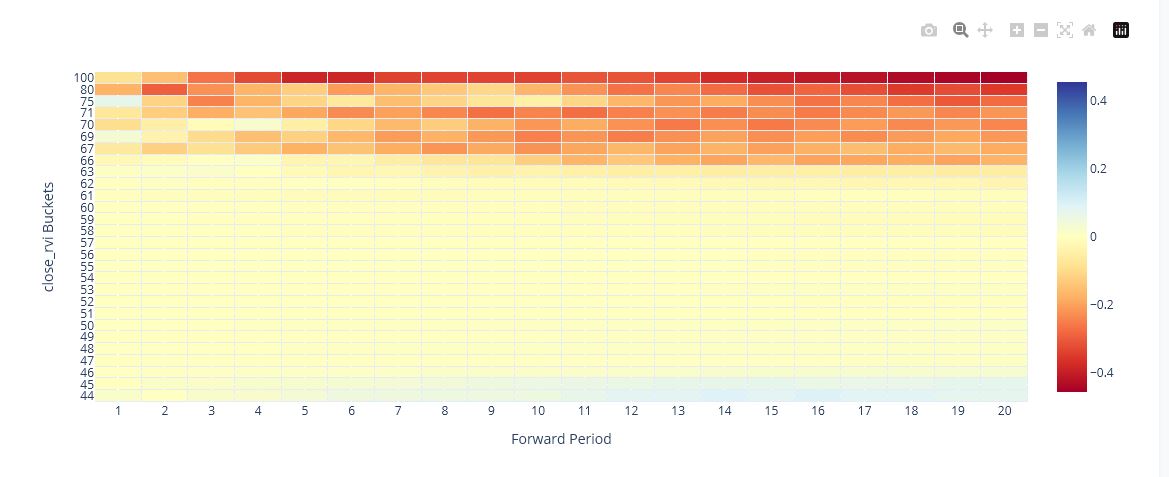
1. Signal-Return Heatmap
See exactly how your indicator correlates with future returns across different time horizons. The heatmap visualization makes it easy to spot:
- Optimal indicator levels for entry points
- How long the predictive power lasts
- Which indicator ranges to avoid
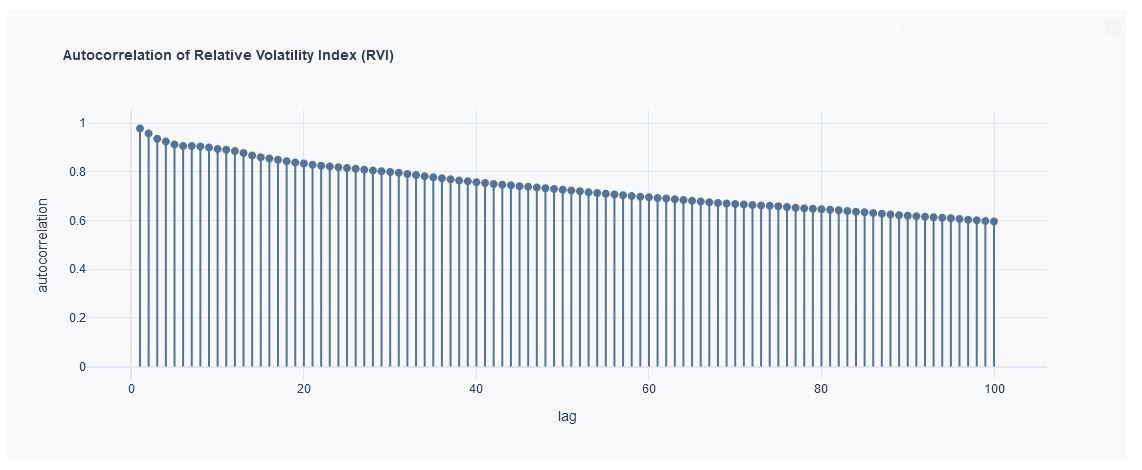
2. Autocorrelation Insights
Discover how your indicator’s values relate to each other over time, helping you:
- Understand mean reversion tendencies
- Spot persistent trends
- Identify optimal holding periods
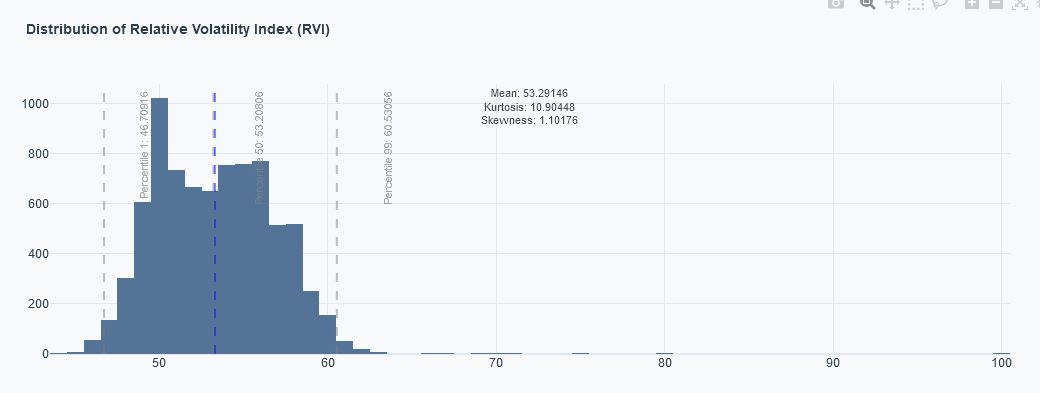
3. Distribution Analysis
Understand your indicator’s statistical fingerprint with a detailed distribution view that reveals:
- Normal vs. abnormal readings
- Frequency of extreme values
- Natural ranges and boundaries
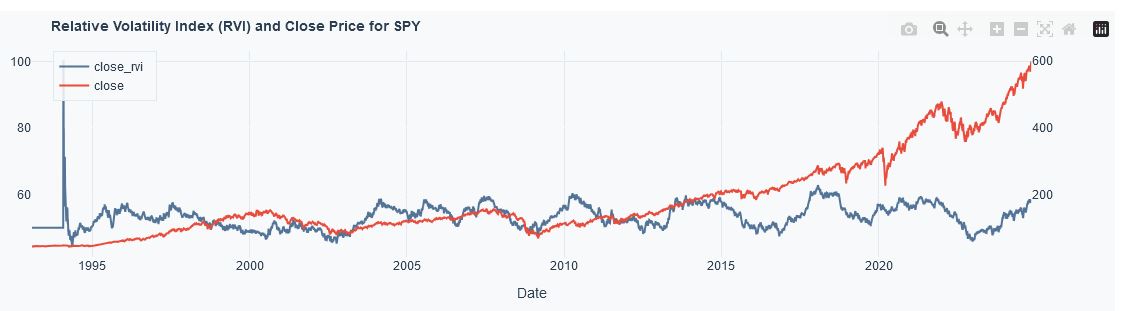
4. Price-Signal Overview
A reference chart to check how your indicator moves alongside the underlying price of the security and assess historical context for current readings.
Putting It Into Practice
Let’s say you’re analyzing RVI for SPY. Load it up, and instantly you’ll see:
- Which RSI levels historically preceded the strongest moves
- How long RSI’s predictive power typically lasts
- Whether extreme readings mean what you think they mean
- If RSI behaves differently in this market compared to others
Why This Matters
Having an edge isn’t just about knowing an indicator’s value - it’s about understanding its complete behavioral profile so you can trade the right things at the right time.
With Indicator Profiling, you’re:
- Making data-driven decisions instead of being exposed to recency or confirmation bias.
- Understanding exactly when your indicators work best
- Optimizing your entry and exit points to maximize your EV
- Building strategies and intuition based on statistical evidence, not hunches
Ready to Profile Your Indicators?
Head over to Indicator Profiling on StatsViz and give your favorite indicators a proper statistical checkup. Drop us a note in the feedback if you don’t see your indicator listed. Whether you’re day trading or swing trading, understanding the statistical characteristics of your indicators at this depth is critical to hone your edge.
Remember: The best traders aren’t just using indicators - they’re understanding them. Start profiling yours today.
