New Feature Spotlight: Day-of-Month Seasonality
Day-of-Month Seasonality is now available on the landing page. This offers users the ability to examine daily performance of financial instruments and associated statistics, complementing the existing monthly seasonality view.
Key Insights from FXB Analysis:
- A reminder that log returns are additive which is one of the main reasons to use it.
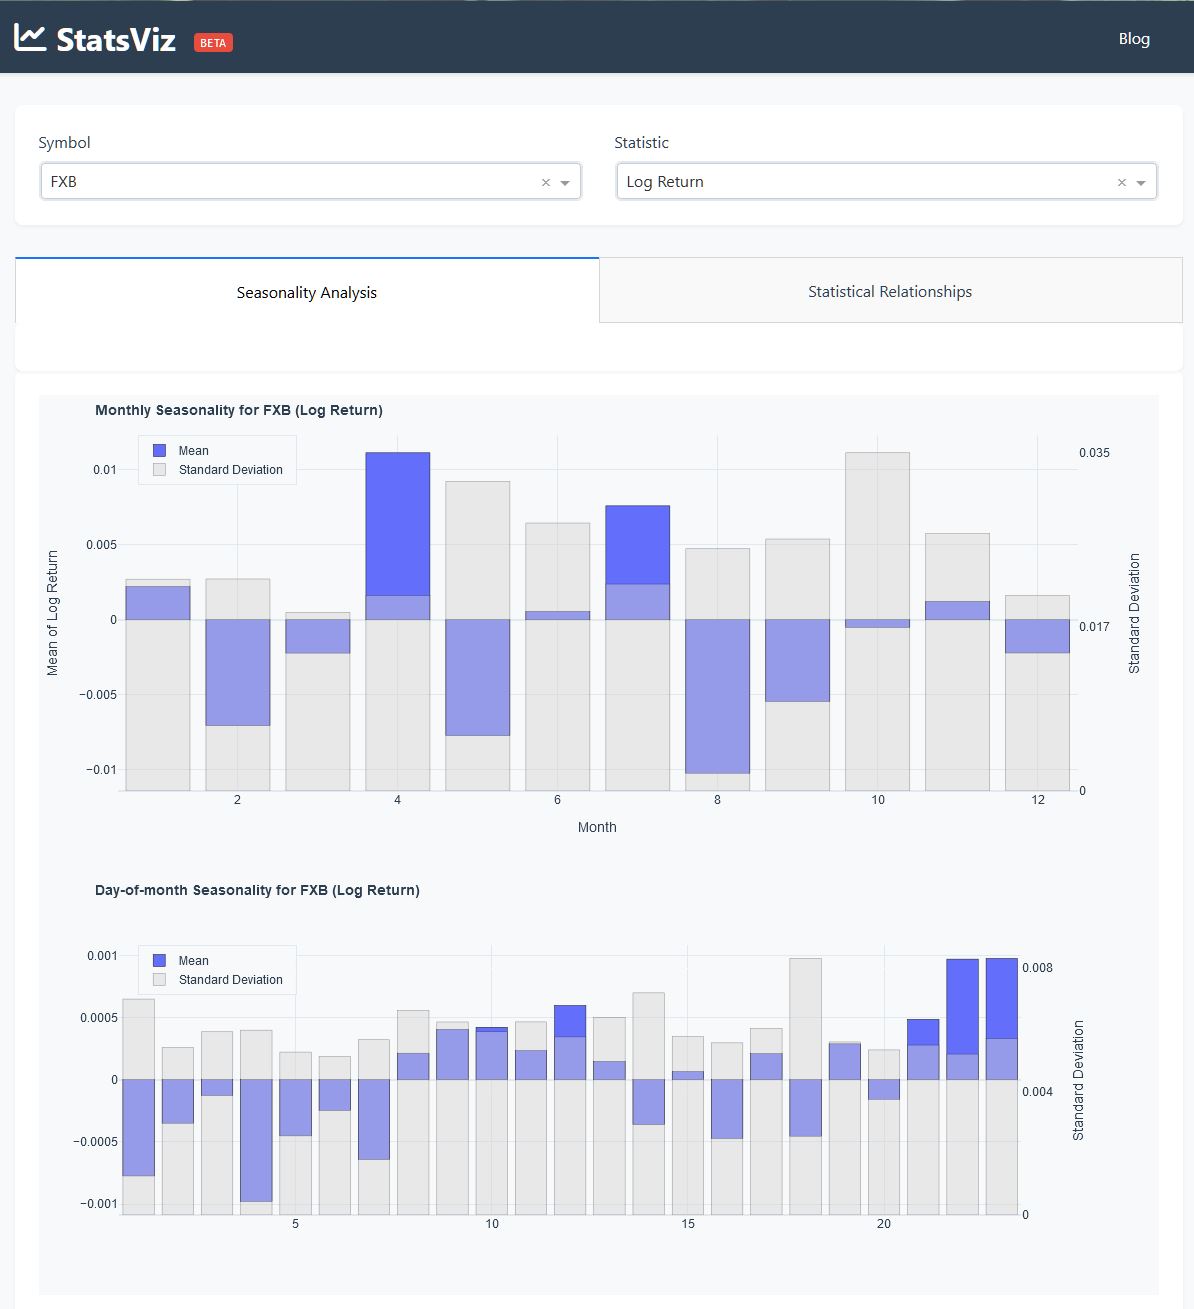
- Negative Returns at the Start of the Month: The day-of-month seasonality chart for FXB reveals a distinct pattern of negative mean log returns during the first few days of the month. While this might initially appear to be a promising trading signal, it is important to note that this pattern is common among dividend-paying ETFs. FXB typically goes ex-dividend on the first of the month, with dividend payouts occurring around the 7th to 9th. This timing likely drives the early-month declines, as the dividend adjustment impacts the price.
- Mid-Month Stability and End-of-Month Strength: After the early dip, mid-month returns stabilize with modest averages, while the end of the month often shows an uptick in returns although accompanied by higher variability.
Implications:
Despite the noticeable early-month decline, it is unlikely that this effect is tradeable due to its association with dividend adjustments—a known and expected event. This insight underscores the importance of understanding not just patterns, but the underlying reasons behind them to avoid false signals.
Why Focus on Day-Level Insights?
While monthly seasonality offers a broad overview, day-of-month seasonality provides a more detailed perspective of the trading environment. This insight allows traders to fine-tune their strategies and adapt to specific intra-month patterns.
Explore how the Day-of-Month Seasonality Analysis on StatsViz can deepen your market insights and help you make more informed trading decisions.
